Aurora forecast for the week ahead
Predicted aurora activity based on incoming coronal mass ejections and current geomagnetic storm data from NASA's DONKI space weather database.
Current conditions
Low activity expected. Solar conditions are currently quiet. Chances of aurora visibility are low tonight.
The Kp index measures global geomagnetic disturbance on a scale of 0–9. Higher values indicate stronger storm conditions and aurora visible at lower latitudes. Check your location's threshold to know what tonight means for you.
Solar wind · live
DSCOVR satellite · updated every minuteThe next seven nights
CME impact times are predictions - arrival can vary by ±6 hours. Activity may also arise from high-speed solar wind streams not listed here.
Recent significant solar flares
M and X class flares from the past 7 days. Large flares often accompany CMEs that cause aurora.
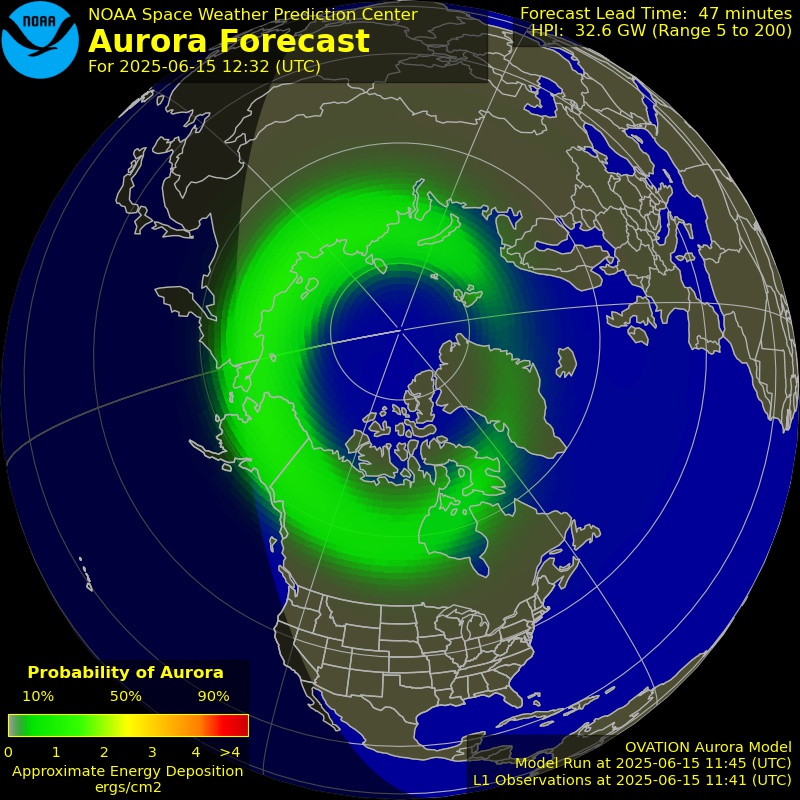
Live aurora oval
The NOAA OVATION model shows the current probability of aurora at each location. Updated every 5 minutes from live solar wind data.
 Forecast · updating… LIVE · NOAA
 What the colours mean
Colour shows the probability of aurora at each point. Dark areas indicate less than 10%. Bright green is around 50%. White areas reach 90% or above.
The bright ring encircling the polar region is the auroral oval - the band where aurora is most concentrated. As the Kp index rises, the oval expands toward lower latitudes.
The HPI figure on the image is the Hemispheric Power Index - the total energy deposited by aurora across the polar region in gigawatts. Below 10 GW is quiet, 20–50 GW is active, above 50 GW is a significant event.